BitSpeed Inspect Explains HTTP Transfers and Compares Saved Runs
A slow request gives you a duration. The next question is where that duration came from, and whether the same interval changed after you adjusted something. BitSpeed Inspect records the client events behind one HTTP transfer and turns them into an explanation you can revisit.
Inspect 0.1.1 is available as an independent Go command. It saves JSON, explains one recording and compares two sets of samples. Transfer is a separate tool under development, so there is no need to wait for a resumable-transfer engine to use Inspect.
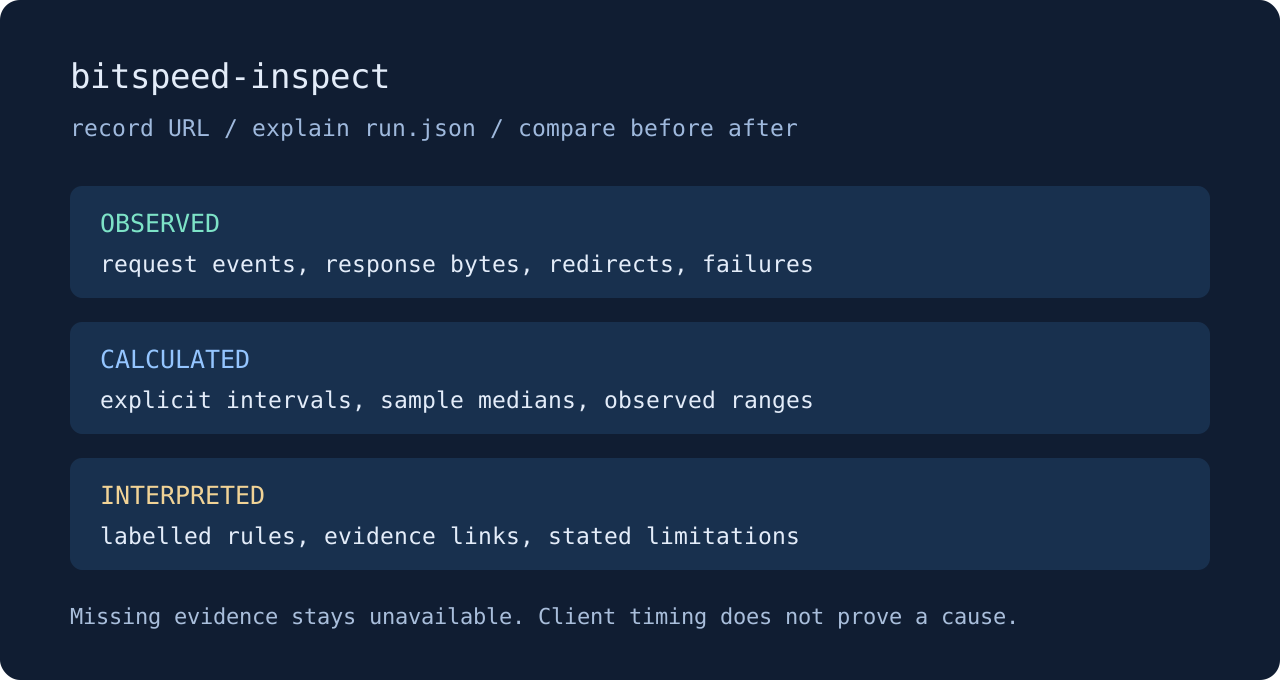
The report keeps three kinds of statement visible. Observations record what happened. Calculations derive intervals and statistics from those events. Interpretations identify their evidence and limits. A long first-byte wait does not magically become proof of slow origin processing. That distinction matters when an attractive explanation would otherwise outrun the measurement.
Comparisons preserve useful phase statistics but withhold unsupported verdicts. Too few samples, missing timings, failed requests and overlapping ranges can leave a result inconclusive. Response differences can limit response conclusions while connection measurements remain useful. There is no claim that a few client traces establish a universal improvement.
Start with the quick start or choose an archive from Download. No account or hosted probe service is required. The reference documents what the measurements mean.